The History Of The Australian House Prices...Charted
The History Of The Australian House Prices...Charted: September 09, 2017
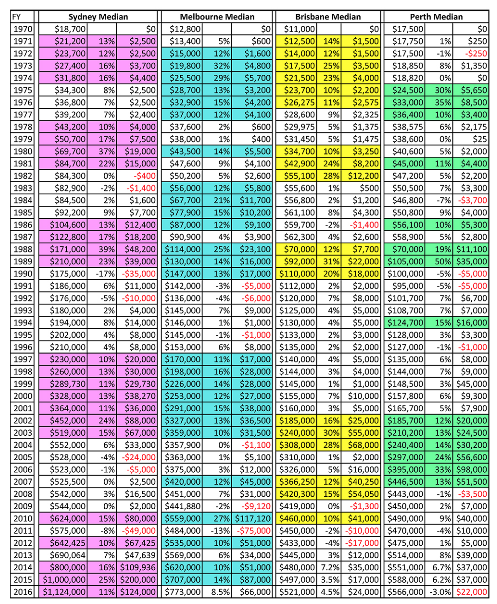
It is with mouth gaping disbelief that we gaze upon this table of house medians since the 70s. Of course, we have to bear in mind that $18,700 median in Sydney and $12,800 in Melbourne, isn't what it is today, however, it was still something that had to be saved and sacrificed for. There is no denying that it was still possible to earn and buy and call oneself a homeowner. Today, it's a different story and the big numbers behind those dollar signs gives us a big clue why the first home owner numbers have plummeted and despite several attempts to resusitate they are still low. It is of course, far more achievable to own a house if you were willing to team up with people to make it a reality. This chart stops at 2016. In 2017, prices have jumped again and we are hearing that it will continue its wild gallop for another 40 years. So...team up and buy or run the risk of renting for the rest of your life. Co-buying is a means to an end. It doesn't have to be forever, just enough to get you into the market. Use Home Addressed's co-ownership contract to keep things nice, find your partner at Home Addressed and you are on your way to building a strong financial platform for yourself.
c